HTML5 is an advanced version of the HTML language which supports audio-visual elements. This means when you use HTML5 to build your app or website, you will be able to run JavaScript as it supports it. It allows your websites or application to be more powerful and diverse. Canvas graphing is one of the major trends in the web design world today. With the use of HTML5, developers have been able to add dynamic features to websites such as data transformation to graphs and charts.
HTML5 canvas graph elements will help you add graphs and charts with data or information that changes constantly due to its flexibility and dynamic nature using JavaScript. The HTML5 canvas also helps developers in the use of JavaScript to draw objects in two-dimensions. Canvas elements have changed the way websites are designed nowadays.
HTML5 JavaScript Libraries for Creating Beautiful Charts
So, in this article, we will be sharing with you some of the most awesome demos, experiments, and libraries that you can use as a solution in the creation of charts and HTML5 canvas graphs. This is more like an HTML5 canvas tutorial which will teach you the steps involved in creating or drawing graphs and charts on your websites or applications.

These canvas elements are some of the best solutions every web developer should know about and they are as follows:
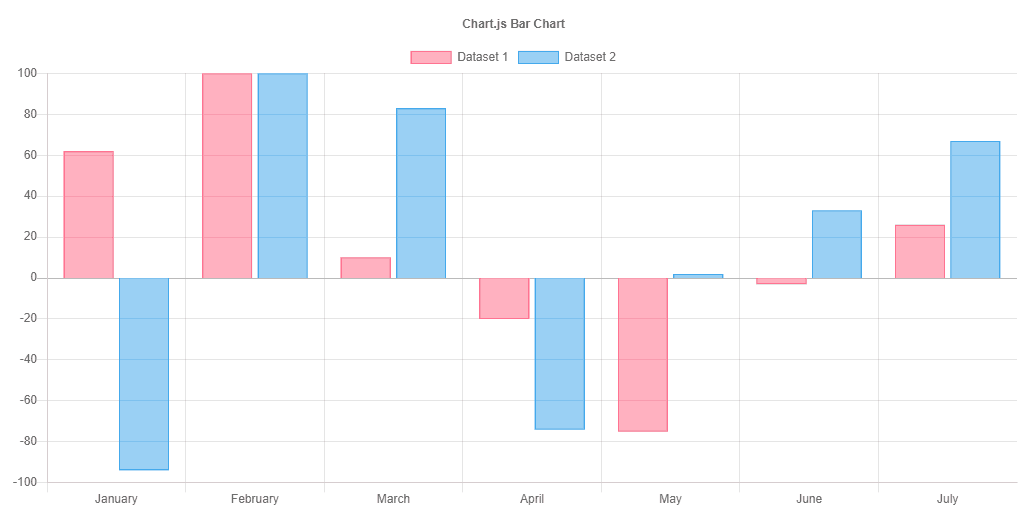
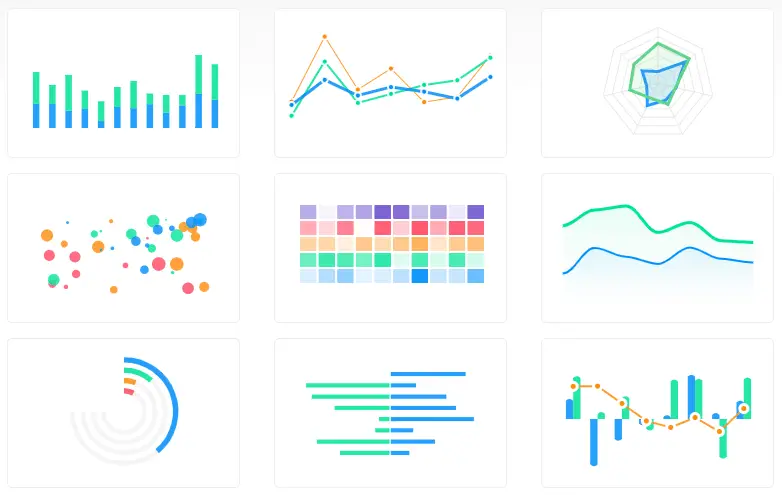
ChartJS
If you want flat design charts for data presentation of your site or app, then ChartJS is what you need. ChartJS uses the latest HTML5 canvas element to render information on a chart or graph and it is compatible with all browsers. It is used for creating charts that work great with mobile, desktop and tablets and it has 8 chart types that can be used to present data or information such as radar, scatter, line, pie, bar, polar area, doughnut, bubble, and area charts. You can also mix them up for in-depth data analysis that is highly customizable and animated.
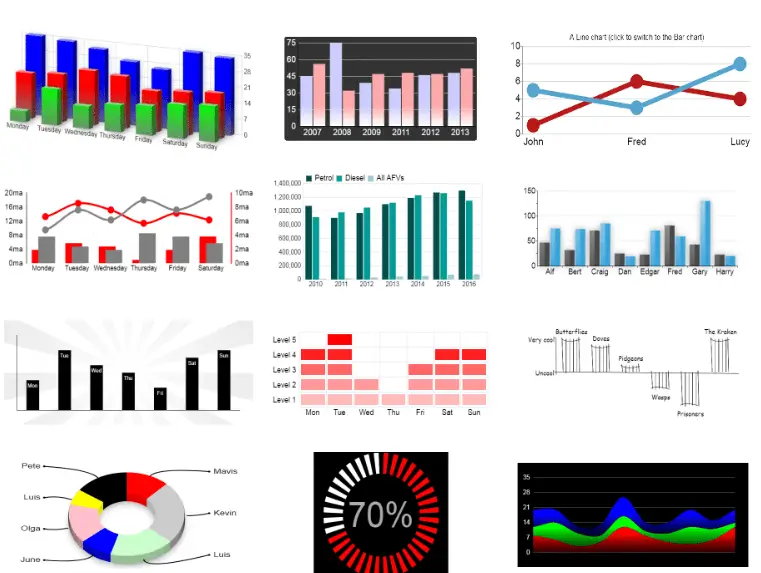
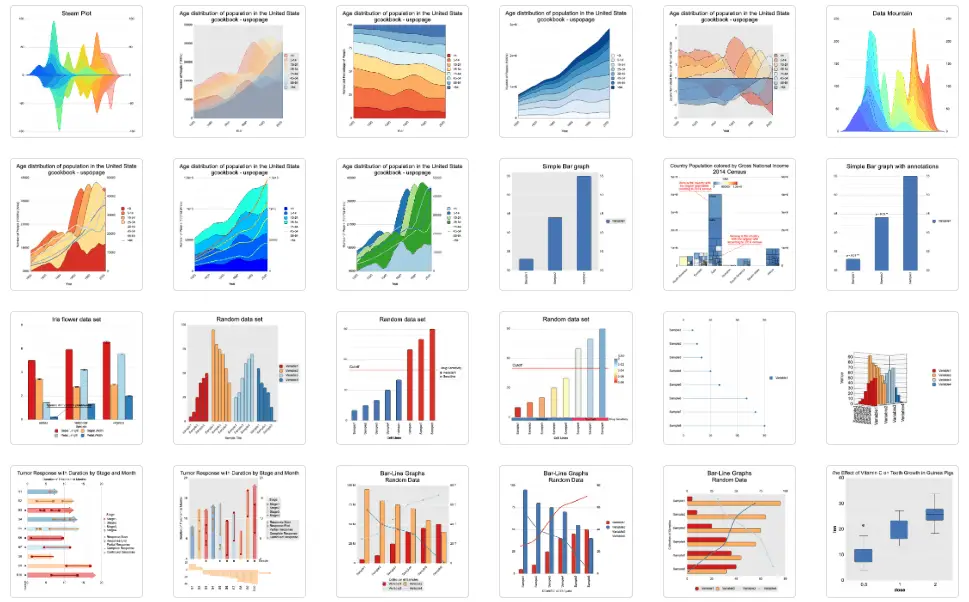
rGraph Using HTML5 elements
rGraph is another great plugin that creates beautiful charts and graphs using HTML5 elements for both websites and applications. It is a fast, open-source chart that anyone can use for his or her web design or app development projects. This pretty and functional canvas library, comes with a lot of features and different types of graphs such as bi-polar or age frequency chart, doughnut chart, bar chart, horizontal bar chart, funnel chart, line graph, Gantt chart, pie chart, rose chart, traditional radar chart, odometer, LED display, scatter graph, meter, and progress bar.
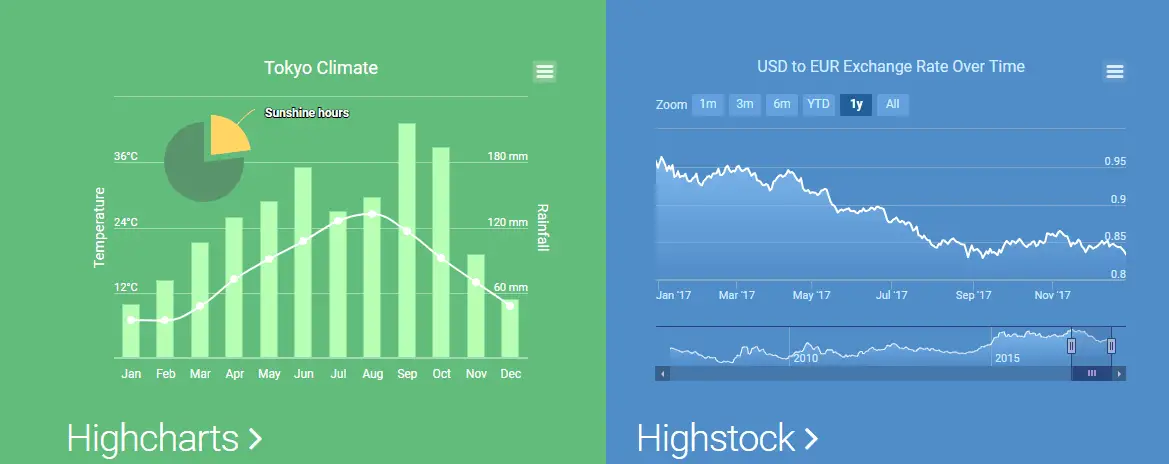
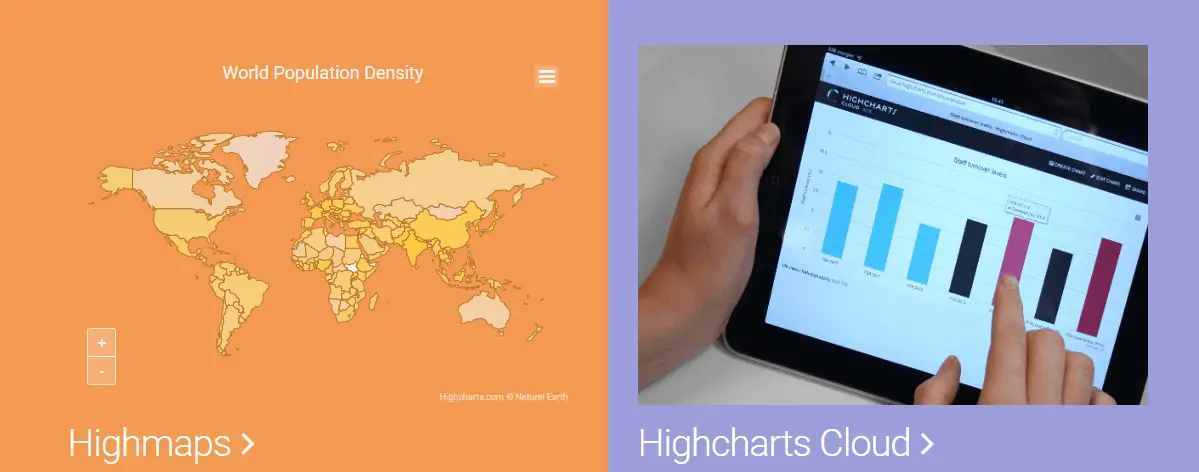
Highcharts – Interactive JavaScript Charts
This is a free visualization tool for the financial market, it is great for creating charts, making the financial analysis and market predictions such as currencies, stock and commodities. Highcharts uses HTML5 canvas elements to draw these charts and graphs using the financial data available.
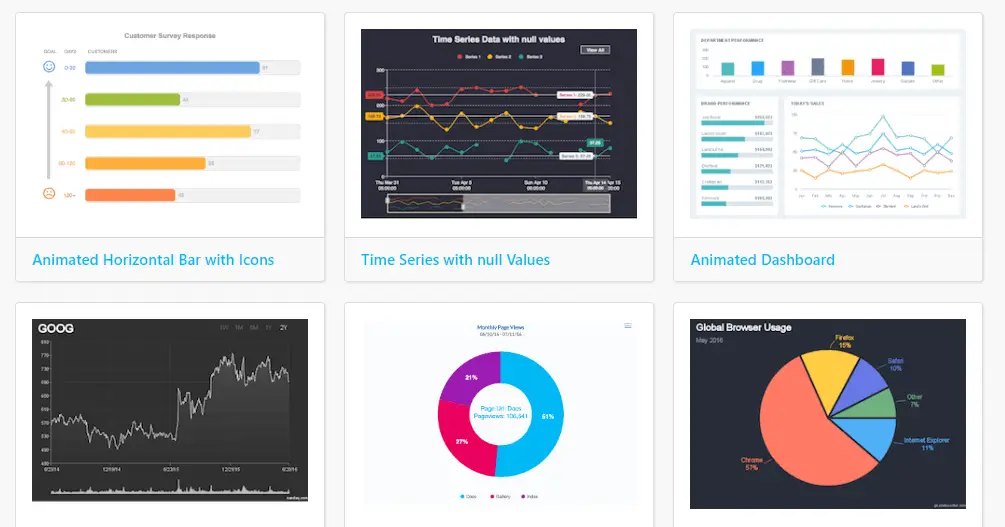
CanvasJS
This is a responsive HTML5 canvas element great for plotting graphs and charts on your websites or web apps. CanvasJS is a simple API with high performing charting library, it includes 30 different types of charts such as bar, spline, line, doughnut, area, stacked charts, column, pie, etc. They are all documented and easy to implement, all the charts also include a lot of features that make them very interactive such as zooming, animation, tooltips, panning, and so on. It works well with other major frameworks like jQuery, Angular, and React. Server-side technology integration is not left out as it can be integrated with ASP.Net, PHP, Java, Python, Ruby, and Node.JS.
Snazzy Animated Pie Chart with HTML5 and jQuery
Snazzy animated pie chart uses HTML5, CSS, JavaScript, and jQuery with a bit of maths. You can use this tool to create awesome pie charts that are animated and colourful. Back in the days, this used to be possible using Flash but today, you can a lot of elements to create a cool HTML5 canvas graph.
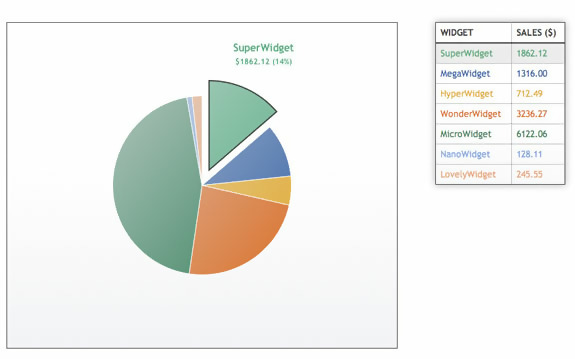
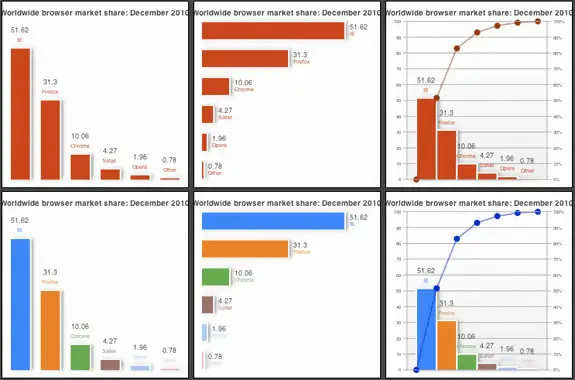
AwesomeJS
AwesomeJS is a fully customizable, simple and easy to use graphing tool for creating HTML5 canvas graph. It was designed to help users in the easiest way possible when it comes to chart and graph creation quickly with simple codes. You can use the AwesomChartJS to create pie, Pareto, bar and doughnut charts in no time with just a simple click. This is definitely one great solution to all your graphing problems.
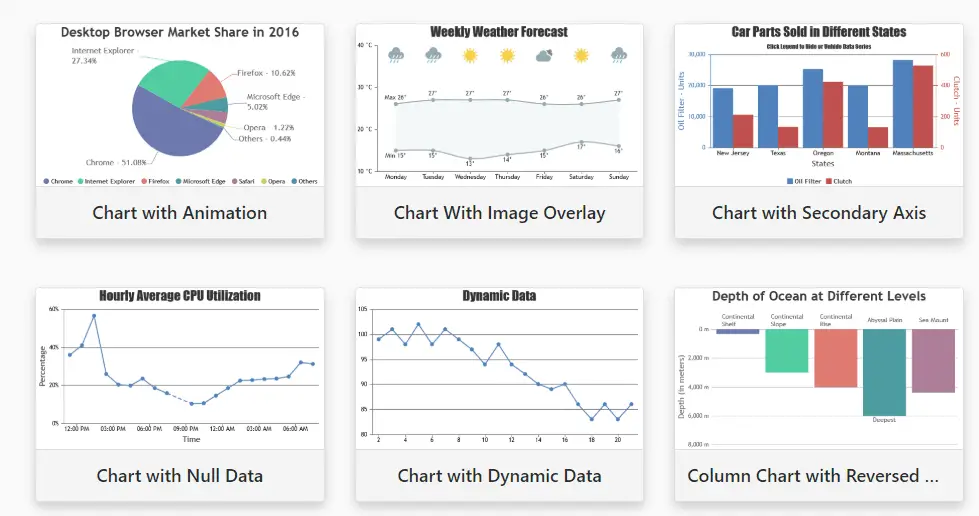
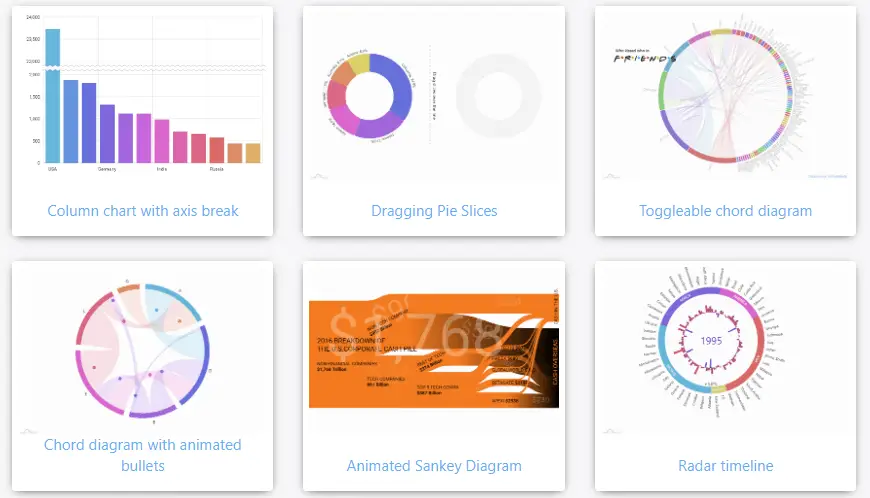
amCharts – JavaScript Charts & Maps
amCharts is a JavaScript library that uses HTML5 to render charts and graphs. It uses your web browser to plot scientific data on a graph or chart very fast and easily. amCharts is very easy to implement in your web page or web application, and it renders data in different plot types such as scatter plots, line plots, zone plots or density map, boxes, and bars. One of its many features includes the ability to interact and customize graphs and charts or downloading an SVG result for scientific publications or static displays.
CanvasXpress – Standalone HTML5 JavaScript library
CanvasXpress is a graphing tool that uses the HTML5 canvas element to create amazing data graphs and charts. It is a standalone JavaScript library combined with HTML5 that makes this tool compatible with all modern browsers. CanvasXpress can track all interactions which can be used later for Reproducible research. Its user interface is very attractive but it does the job efficiently.
ZingChart
ZingChart is one of the very few tools that you can use to render data on charts and graphs in HTML5 and Flash. This is an exceptional tool that comes with over 30 different types of charts and graphs to use when displaying data. It is interactive and brings your data to life such that you can zoom in at a particular point or data segment, and so on. Its library is full of tools to make you interact with your charts or graphs. ZingChart is stylish, colourful and powerful with fast performance. Get it now!
Apex Charts – Modern & Interactive Open-source Charts
Apex Charts is a jQuery plugin that uses JavaScript to create user-friendly charts and graphs with progressive enhancement. The use of JavaScript helps this plugin with the creation of HTML5 canvas graph. It also helps with the gathering of data and information from an HTML table, the scraped data is then used by the HTML5 canvas element to generate areas, bars, lines, and pie charts. This transformation is known as a chart or graph visualizations and makes data presentation on any website smooth and clean.
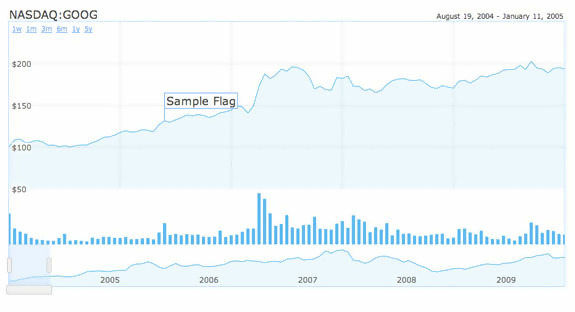
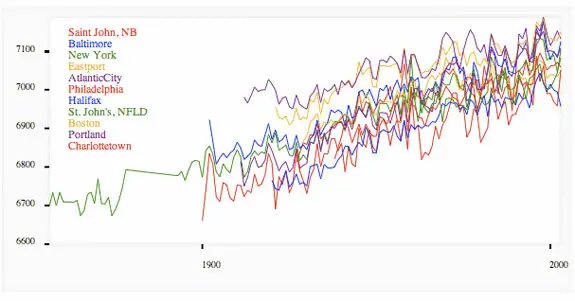
HumbleFinance – Stock Data HTML5 Canvas
HumbleFinance is a simple and smooth ope-source data visualization tool that was developed as a demo solution for interactive graphing. This tool is almost similar to the Google Finance tool. HumbleFinance uses full JavaScript, Prototype and Flotr libraries which can be used to display two sets of 2-D data sharing the same axis with numerical data. It uses HTML5 canvas elements to create graphs and charts.
Charting HTML5
This is an HTML5 canvas element that you can use to generate information for your graphs and charts. The author used Charting HTML5 as an experiment to see its performance when rendering charts. It works well with any HTML5 supported browser but preferably Google Chrome. Check it out and start plotting graphs and charts.
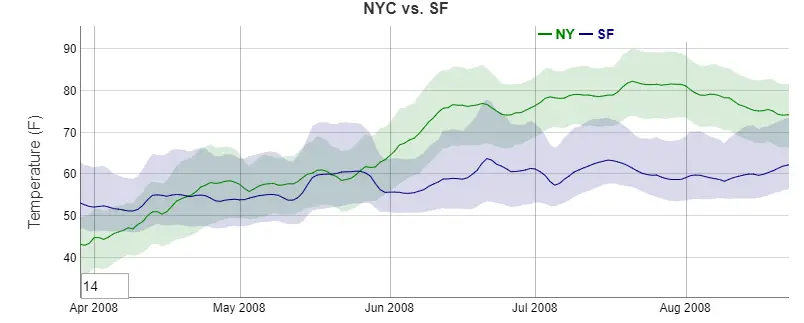
dygraphs
This is an open-source graphing tool that its JavaScript library is lightweight, fast and can render very large data sets at a go. DyGraphs is an interactive tool for rendering data on charts and graphs with many features that are supported on mobile devices also such as pinch, zoom, and more. This HTML5 canvas graph tool is compatible with almost all the major browsers and even some older versions like IE8. It is highly customizable and free for everyone to use.
HTML5 Graph Slider
This is a dynamic HTML5 canvas element that enables users to view JavaScript data which is then updated on a graph. The JS frameworks give it additional functionality to make it dynamic. The HTML5 graph slider uses jQuery and it user-interface which makes the sliders responsive thereby creating a chart and graph.
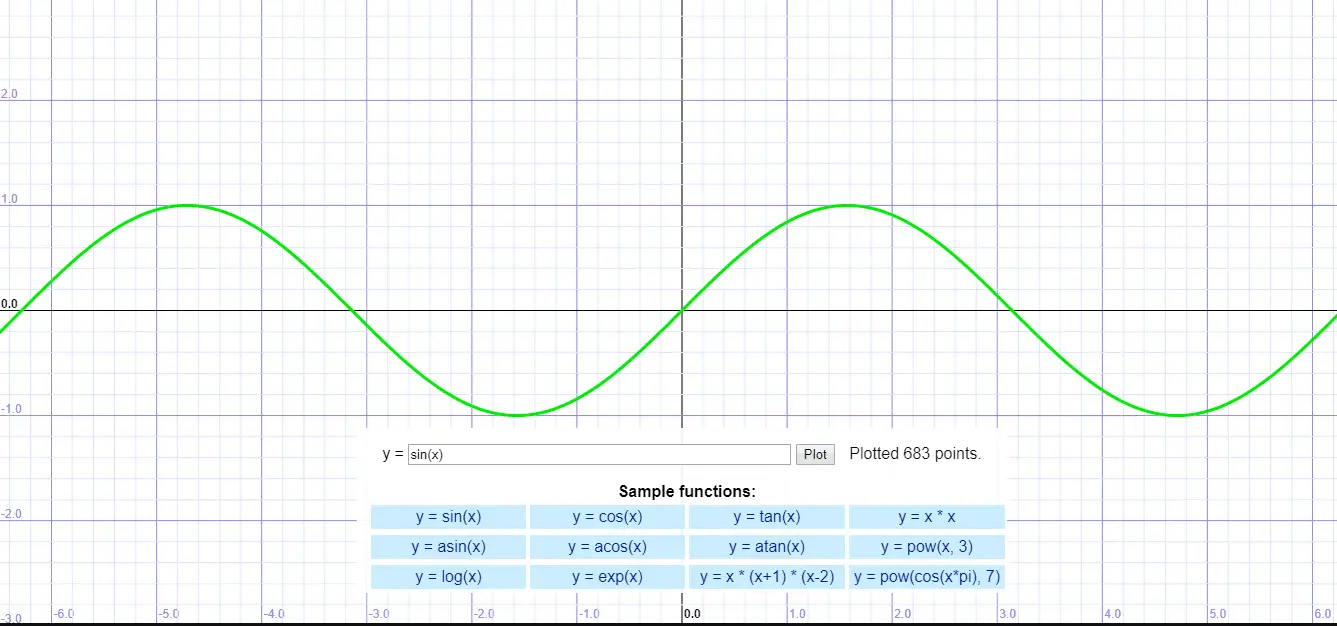
2D Function Plotter
Function plotter is an amazing HTML5 canvas that will add that great chart and graph you have always wanted to implement on your website or application. It is a tool that was created by a developer known as Ed Mackey, this tool creates 2D mathematical data representation or analysis on a graph using HTML5 canvas element.
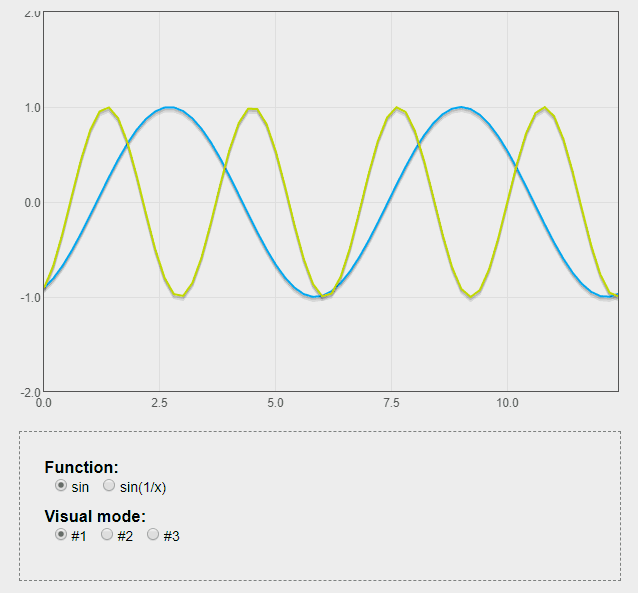
Trigonometry Using Canvas and JavaScript
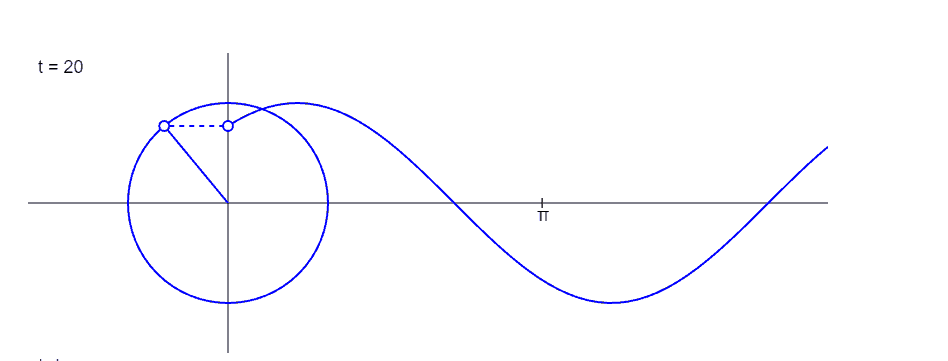
Fathom using Canvas and JavaScript
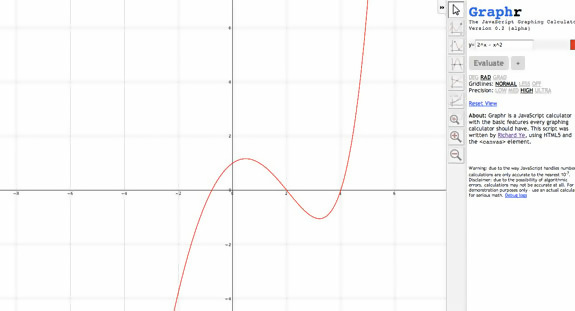
Graphr – The JavaScript Graphing Calculator
Graphr is one JavaScript tool that is also great when it comes to solving your graphing problems. Written by Richard Ye, this tool uses HTML5 canvas elements to gather data. It is a graphical calculator that supports has a lot of functions such as Cartesian plane in algebraical calculations. It is fast and supports panning, zooming, accurate graphing and more. Other features that come with this HTML5 canvas graph include derivative, root, tracing tools etc.
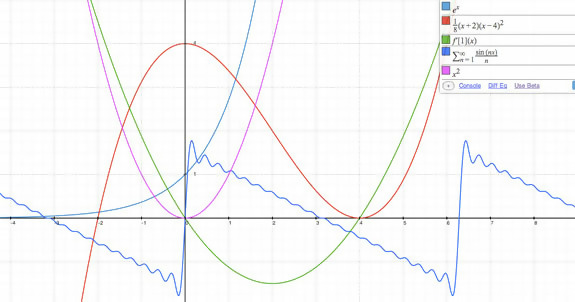
Graph.tk
Grapgh.tk is an open-source web graphing tool that is highly compatible with all the modern browsers such as Firefox 4+, Internet Explorer 9+, Opera 11.60+, Google Chrome 14+, and Safari 5+. This graphing solution uses HTML5 canvas elements to plot and display data on charts and graphs with finesse. Graph.tk has an intuitive interface that lets users interact and solve math problems quickly and easily. It does not require any installation because the HTML5 feature makes this tool run within your browser. It works well, saves your graphs and functions even without an internet connection.
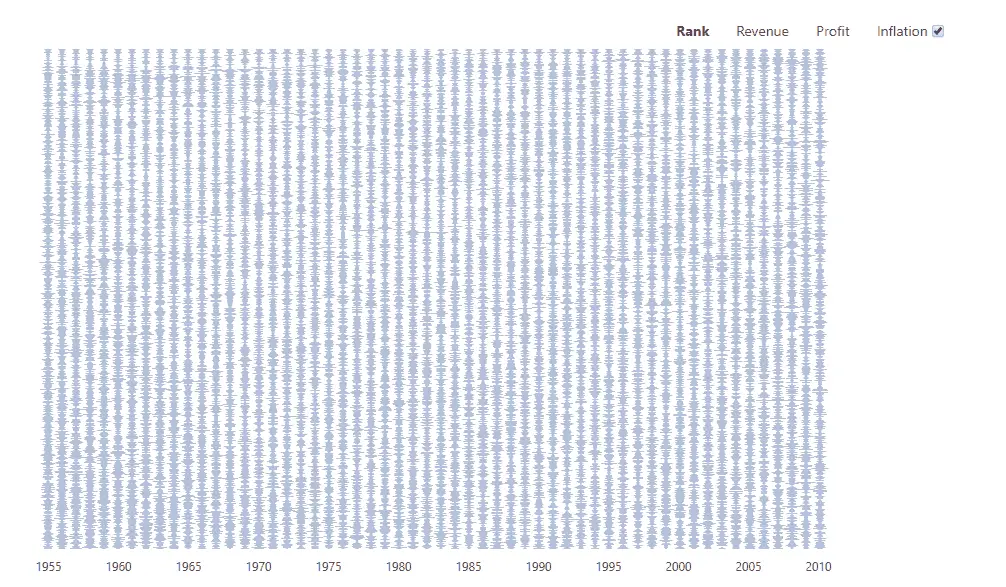
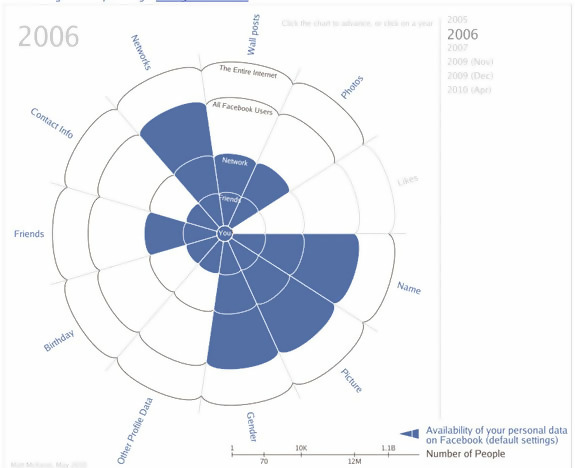
Facebook Privacy Chart
This Facebook privacy chart was created by Matt McKeon, a developer at IBM Research Center for Social Software. The developer has done a great job using canvas elements to create an HTML5canvas graph showing the data on the availability of users private information on the platform.
HTML5 Canvas Tutorials to Help You Create Charts and Graphs
As a web developer who is working on a project for a client or for personal use that requires charts and graphs. The above list of HTML5 canvas graph tools will help you out with your challenge. Also, for those of you who are still learning about HTML5, we have compiled a list of links to read further that will help you with your feat. Below are some of the HTML5 canvas tutorials that might be useful to you:
Getting Started With HTML5 Canvas Elements
How to draw with HTML5 Canvas: If you do not know how to use HTML5 canvas to draw charts and graphs, then this article by “Think Vitamin” should be of great help. It includes links and demonstrations on how to use the HTML5 canvas element to draw and much more.
HTML5 Canvas: The Basics: This is a step-by-step guide about all the basics you need to know concerning the HTML5 Canvas element and getting started with detailed explanations.
W3Schools HTML5 Canvas: W3Schools is one of the best places to learn everything about web development. It has in-depth explanations about the HTML5 Canvas element with detailed examples.
HTML5 Canvas Element Guide: Yet another perfect guide on how to draw and why you should use the HTML5 canvas element.
5 Clever Uses of the Canvas Tag: In this tutorial, you will learn about the 5 clever uses of the HTML5 canvas tag and how they are implemented on various websites and apps today.
Step-by-Step Tutorials on Creating Charts and Graphs
After understanding the basic and how to draw lines and so on using HTML5, you will need to advance your skills by learning more sophisticated ways of using the HTML5 canvas elements. Below are HTML5 canvas tutorials you will need to learn how to create HTML5 charts and graphs using canvas elements.
- A Snazzy Animated Pie Chart with HTML5 and jQuery
- Graphing Data in the HTML5 Canvas Element: A four-part series
Conclusion
As a web and app developer, data visualization is key when it comes to analysis which is very important in every business today. Small and large organizations all want to know their weaknesses and strongpoints to eliminate those weak areas affecting their business. By so doing, they resort to data analysis which involves simple, clear and effective ways to interpret data dynamically. We aim to fill the gap for most of you out there who are confused about which charting and graphing libraries to use. We hope this list of HTML5 Canvas graphing solutions with detailed tutorials will help all web enthusiasts who are looking for the best JavaScript graphing tool to implement on their web apps and websites. Let us know which of the tools met your expectations in drawing an HTML5 canvas graph.
-
by
-

Thank you for all of your hard work. I appreciate you sharing. I’ll also impart some helpful knowledge.